During the height of the cold war, Stanislav Petrov was a lieutenant colonel in the Soviet Union’s Air Defense Forces, and his job was to monitor the Soviet satellite system responsible for detecting nuclear missile launches from the United States.
On September 26th, 1983 — just a few weeks after the Soviet Union had shot down a passenger plane with a United States Congressman on board — the satellite system alarm went off, indicating that the U.S. had just launched a nuclear missile toward Russia.
“The siren howled, but I just sat there for a few seconds, staring at the big, back-lit, red screen with the word ‘launch’ on it,” Petrov said in an interview with the BBC.
He sat there for a few seconds, and the alarm went off again. And again. And again. And again. After the fifth alarm, the big red text on Petrov’s computer screen switched from “Launch” to “Missile Strike.” In this situation, Petrov’s training is clear — he is supposed to alert his superiors of the impending attack, but he knows that if he does, they will immediately retaliate with their own nuclear missile strike.
Fortunately, Petrov stopped for a moment to consider the larger context of his situation. Why would the U.S. only launch five missiles? That’s not enough to take out the Soviet Union and will only provoke an equally devastating response. Also, this satellite system, though state of the art, was only a few months old; it is certainly possible that this is a malfunction.
Instead of alerting his superiors, Petrov investigated the situation further and discovered a computer chip malfunction was to blame for the alert. His quick thinking and decision making almost certainly prevented a nuclear war.
Stanislav Petrov’s story highlights the importance and the challenges of data-driven decision making. The two big takeaways:
-
When it comes to making good decisions with data, context is critical
-
Relying on single data points to make decisions can lead to bad outcomes
These two takeaways have a clear connection to the commercial real estate office world, as owners have struggled to unlock the value of heaps of structured and unstructured data they are now able to capture.
What data owners do collect is often spread out amongst their many technology partners, making it difficult to develop an accurate understanding of how tenants use the many features of their commercial office buildings on a day-to-day basis.
As a result, owners are forced to look at more fundamental real estate data points — annual tenant satisfaction surveys, occupancy rates, etc. — to assess how their assets are attracting tenants and differentiating from their competition.
This is why 67% of commercial real estate executives plan to increase data governance investments in the next 18 months, and it is also why we here at HqO created the Building Population Report™.
(Learn about the three main problems HqOS helps landlords solve — Attraction, Differentiation, & Fragmentation — in our HqOS Demo Video)
Introducing The HqO Building Population Report ™
The HqO Building Population Report™ combines behavioral and contextual data to give asset managers and property teams a better understanding of their tenants.
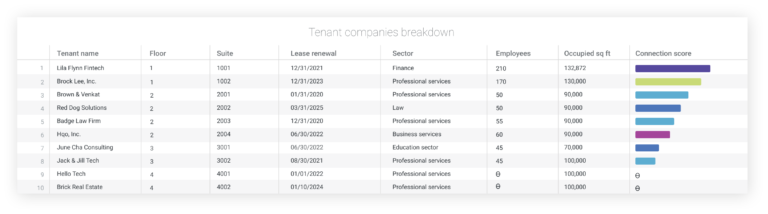
The report produces a “Connection Score” for each tenant, which combines each tenant’s engagement with building features — like booking a conference room — with the number of users and technology tools activated at the property.
The more connected a tenant is, the more we know about them, allowing property teams and asset managers to make smarter decisions at their assets.
Key Capabilities
Integrate data from other technologies to centralize analytics
- Connect with tools — like visitor management — to develop a holistic view of your building population
- Provide additional context to data to uncover actionable insights
Combine population data with behavioral data
- Measure engagement and activation for each tenant company
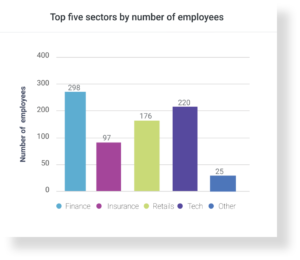
- Identify which tenant business sectors are most engaged at your building
Inform capital expenditures and retention strategies
- Monitor key tenant metrics to identify potential churn risks
- Work with HqO TeX team to increase connection scores
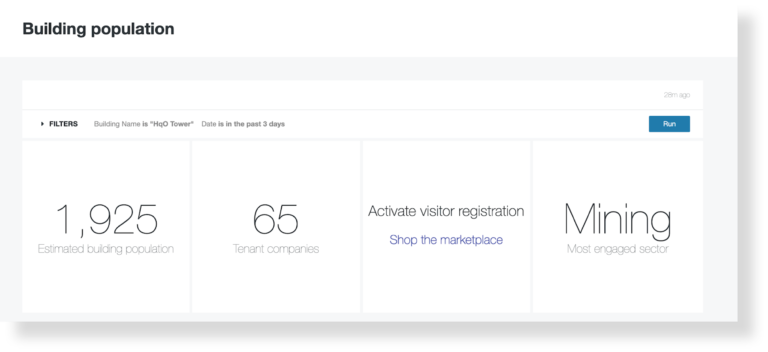
Collect key operational and tenant data points in one place
- Total Population
- Tenant companies
- Registered visitors
Sort population data by:
-
- Tenant company
- Occupied sq. ft.
- Business sector
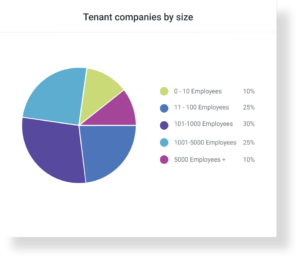
- Company size
At HqO, we believe in the power of connection and the value these connections create for our customers — commercial office owners. Our Building Population Report feature is a critical leap toward enabling owners to make smarter decisions that unlock tenant value and increase operational efficiency.